Have you ever wondered anything about cars and traffic? For the first time ever, a state has released information on all of the cars registered in the state. The Massachusetts Vehicle Census combines detailed (but anonymized) data from the Massachusetts Registry of Motor Vehicles and vehicle safety inspections as part of the 37 Billion Mile Challenge.
We developed tools and visualizations to explore this data, and hope that you will have as much fun using the data as we had putting the tools together. To go to a specific section in this webpage, click a link below.
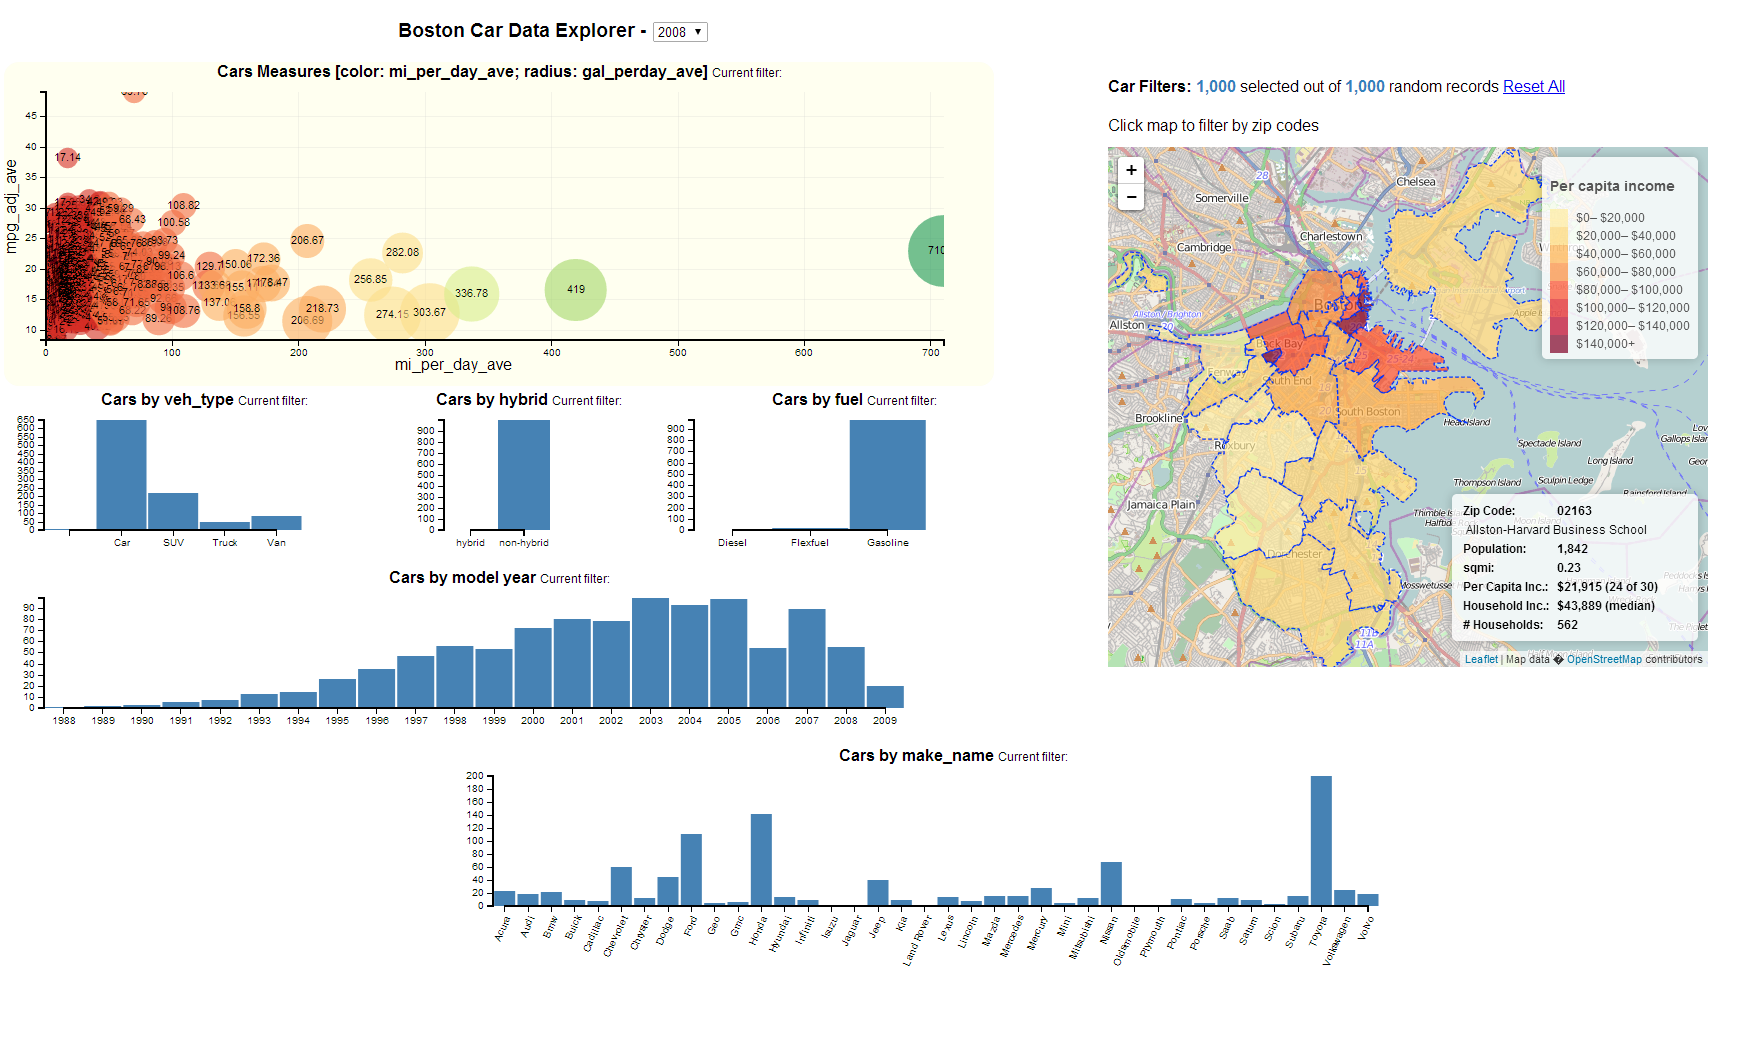
- Boston Car Data Explorer: How does your driving compare to that of other people in your neighborhood? Did the car use in your zip code change between 2008 and 2011? How does driving in your zip code compare to that in other zip codes in Boston? The Boston Car Explorer lets you explore these questions and more.
- Who impacts whom?: Traffic is related to air pollution, noise, and congestion. Which areas in the Boston metropolitan area have more traffic relative to the amount of driving done by cars registered in those areas? Which areas have cars that drive a lot, but don’t have much total traffic?
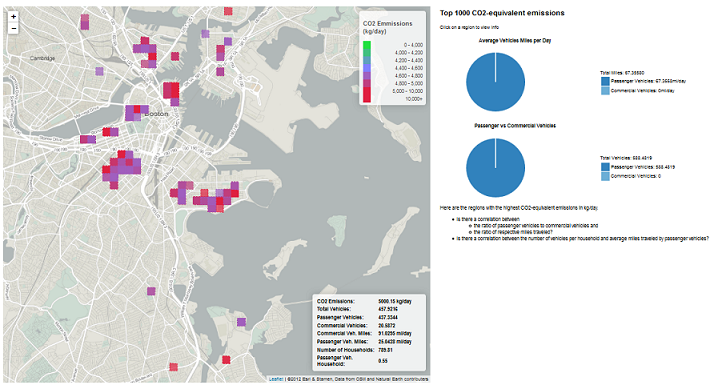
- Top 1000 CO2-equivalent emissions: Explore the vehicle and household information of regions with the highest CO2-equivalent emissions.
- The Data: Do you want to download the data and work with it yourself? Go here to see documentation, download the database, and find sample code to get started using the data.
- About Us: We are a group of developers, designers, data nerds, and transportation enthusiasts interested in using data to make a difference to Massachusetts residents. Formed at the 37 Billion Miles Datathon held in Boston, MA in March of 2014, we are looking to bring together different datasets using an open-source process to build compelling data-driven visualizations to help residents and policy makers get a better grasp on the state's driving habits and how this information can be used to improve the quality of life for the citizens of the Commonwealth.
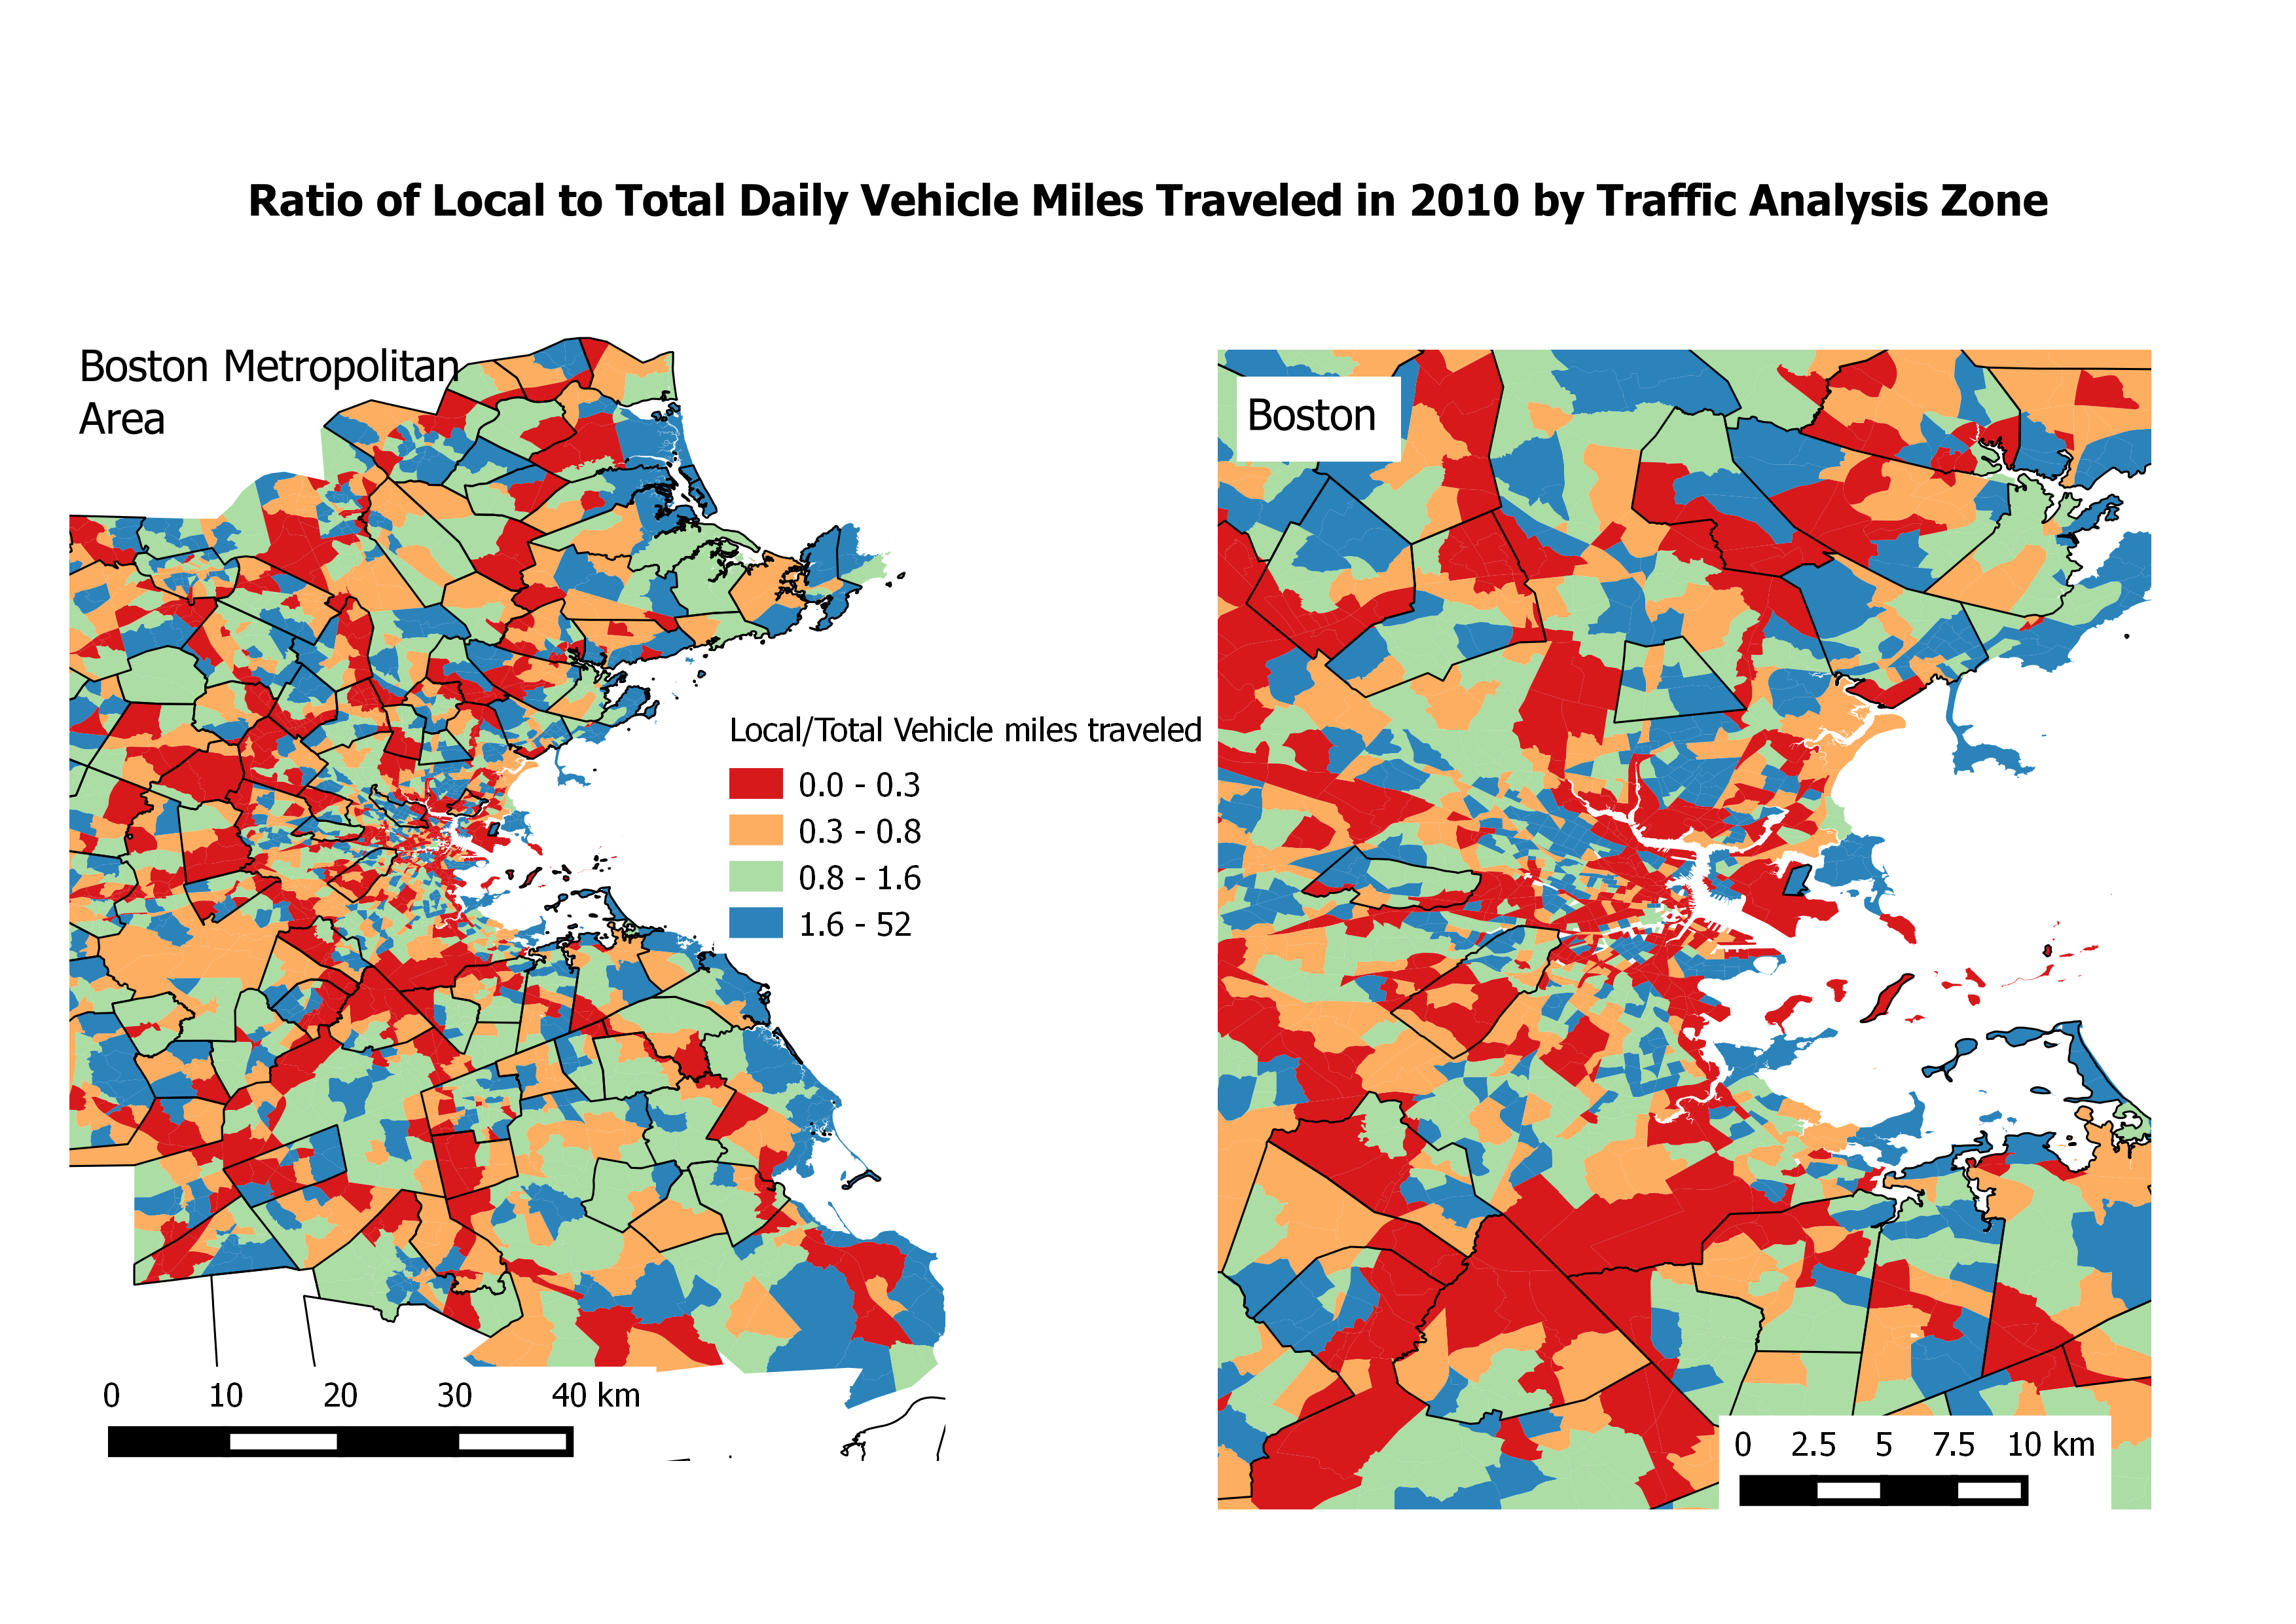
Traffic is related to air pollution, noise, and congestion. Which areas in the Boston metropolitan area have more traffic relative to the amount of driving done by cars registered in those areas? Which areas have cars that drive a lot, but don’t have much total traffic?
These maps compare the total miles traveled by locally registered vehicles to the total miles traveled. Red areas are highly impacted by region traffic. Not surprisingly, these areas are mainly along the interstate highways. Blue areas have cars with a lot of miles driven, but have relatively little traffic themselves. These areas tend to be outside of Boston and in areas with a lot of commuting. Can you find your city on the map? Is your community highly impacted, or is it affecting others?
Click the image above to see full size
Making of the Image
This image of the vehicle miles traveled (VMT) divided by total miles per day in each traffic analysis zone (TAZ) highlights the inequality between places with more vehicle traffic and places where the registered cars drive more miles. Near-highway areas and the Boston metropolitan area pop out as places with exceptionally high traffic volumes and low driving.
Traffic due to passenger vehicles in each TAZ was obtained from grid_quarters_public (mipdaypass). Each grid was assigned to the TAZ which had the highest spatial overlap. TAZ and VMT layers were obtained through CTPS. The image was produced in QGIS.
# R code to generate the figure.

library(RPostgreSQL)

# Start Driver

drv = dbDriver("PostgreSQL")


# new connection

con <- dbConnect(drv, user="massdrive",dbname="massdrivedata")


# rs <- dbSendQuery(con,"select mipdaypass from grid_quarters_public")

# mipdaypass = fetch(rs,n=-1)$mipdaypass

# dbClearResult(rs)


members <- dbSendQuery(con,"select g250m_id,taz_id from g250m_taz_membership")

members = fetch(members,n=-1)

# dbClearResult(members)


mipdaypass <- dbSendQuery(con,"select g250m_id,mipdaypass from grid_quarters_public where quarter = '2010_q2'")

mipdaypass = fetch(mipdaypass,n=-1)

# dbClearResult(mipdaypass)


taz_data_2010 <- dbSendQuery(con,"select taz_id,vmt from taz_data_2010")

taz_data_2010 = fetch(taz_data_2010,n=-1)

# dbClearResult(taz_data_2010)


# Merge by grid miles per day to TAZ-grid membership table

temp1 <- merge(members,mipdaypass,by="g250m_id")


# Aggregate grid to TAZ level

gridtotaz = aggregate(temp1$mipdaypass,by=list(temp1$taz_id),sum,na.rm=F)

names(gridtotaz) = c("taz_id","mipdaypass")


# Merge aggregated grid data to TAZ data

temp2 <- merge(gridtotaz,taz_data_2010,by = "taz_id")

temp2$ratio = ifelse(temp2$mipdaypass>0,temp2$vmt/temp2$mipdaypass,NA)


# write to csv file

write.csv(subset(temp2,!is.na(ratio)),"ratio2.csv",row.names=F)


## Closes the connection

dbDisconnect(con)


## Frees all the resources on the driver

dbUnloadDriver(drv)
How does your driving compare to that of other people in your neighborhood? Did the car use in your zip code change between 2008 and 2011? How does driving in your zip code compare to that in other zip codes in Boston? The Boston Car Data Explorer lets you explore these questions and more. Click here to start the demo
You will see these graphs:
- Vehicle mileage (mpg_adj_ave) compared to miles traveled per day: How efficient is your car compared to other cars?
- What kind of vehicle (veh_type) dominates?
- How many hybrid cars are registered?
- What types of fuel are being used?
- How old are most cars?
- Which car makes are most popular?
This was part of an investigation that focused on a popular subset of data -- 21 zip codes within just the Boston municipality. This provided a more manageable dataset with which to visually explore intersections of many filters using multi-dimensional charting. Household income demographic data was incorporated as a new filter. The resulting highly interactive "Boston Car Data Explorer" web page provides a sense of the variety of interacting factors, and can be extended to explore data for all of Massachusetts at the grid cell to county level. A next step in this effort would be to employ data analytics to identify alternative data sources for filters and measures, along with incorporating additional external data sources.
Click the image to see it full-size
CO2 Emissions Data
Top 1000 CO2-equivalent emissions: Explore the vehicle and household information of regions with the highest CO2-equivalent emissions.
Click the image to see it full-size
We are a group of developers, designers, data nerds, and transportation enthusiasts interested in using data to make a difference to Massachusetts residents. Formed at the 37 Billion Miles Datathon held in Boston, MA in March of 2014, we are looking to bring together different datasets using an open-source process to build compelling data-driven visualizations to help residents and policy makers get a better grasp on the state's driving habits and how this information can be used to improve the quality of life for the citizens of the Commonwealth.
Team Members (alphabetical order)

Alexis Chan - Alexis is a software engineer at MathWorks with experience in building user-interfaces for visualizing data.

Alan Esenther - Alan is a research scientist/chief software engineer with interests in data visualization, big data, GIS and full stack development. He has worked in corporate (Mitsubishi Electric Research Labs) and startup (Circle Twelve Inc.) environments, focusing on both research prototypes/papers/patents and on product development.

Kartik Khanna - Kartik is a R&D analyst at Travelers with an interest is big data and machine learning.

Allison Patton - Allison is a researcher with the Community Assessment of Freeway Exposure and Health at Tufts University. Her research focuses on measuring and modeling the effects of traffic on air quality for use in epidemiological exposure assessment.

Evan Patton - Evan is a Ph.D. student at Rensselaer Polytechnic Institute working in the areas of data science, knowledge representation, and artificial intelligence. He is passionate about making data open and accessible in order for it to reach its full potential. He has experience in full stack web development and his thesis focuses on analyzing energy consumption and performance of artificial intelligent systems for mobile phones.
We have collected a number of notes about our efforts to better model the underlying data as well as various quality control methods we looked at. Please visit our data wiki on GitHub to access these additional materials, including a SQL dump and instructions for setting up your own copy of the database we used for generating these visualizations.
If you have any questions about the datasets we've generated, please feel free to contact us via our Google Groups page.
All source code generated by the team © 2014 Alexis Chan, Alan Esenther, Kartik Khanna, Allison Patton, & Evan Patton and are released under the Affero GNU Public License v3.

MassVehicleExplorer by Team Cornish Rex is licensed under a Creative Commons Attribution-ShareAlike 4.0 International License.
Based on a work at http://www.37billionmilechallenge.org/.